Revenue Dashboard
41
Explore key revenue insights with this interactive Tableau d
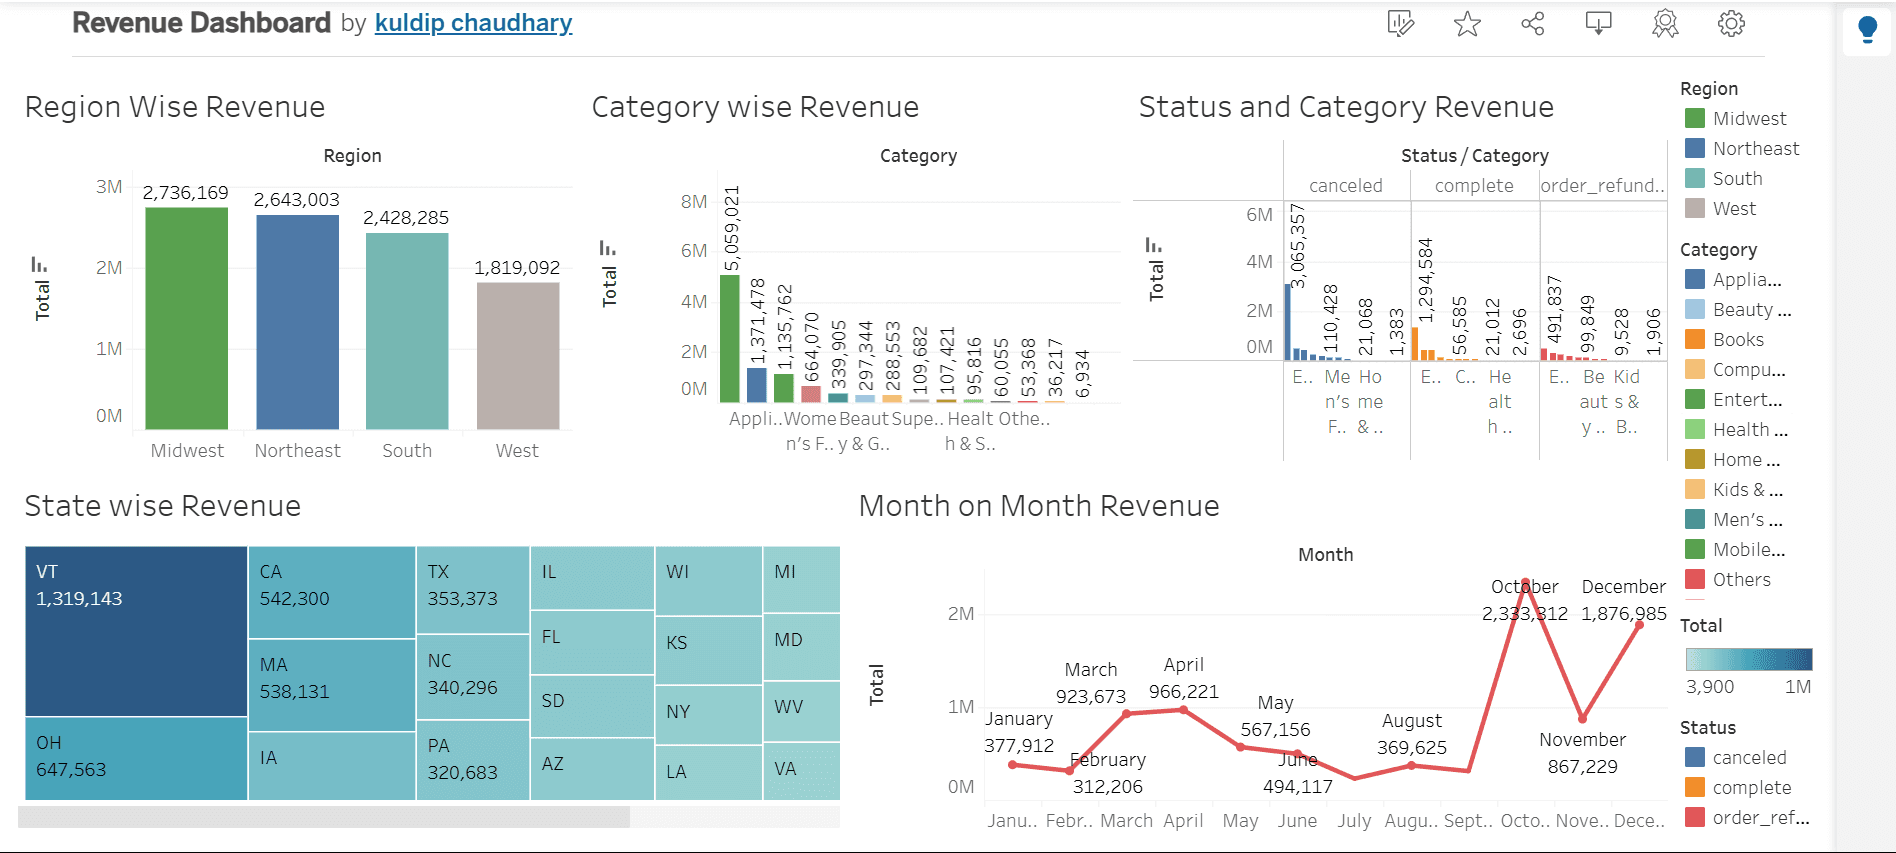
This Tableau Revenue Dashboard project is designed to provide a comprehensive and interactive overview of a business’s revenue performance. The dashboard visualizes key financial metrics such as total revenue, monthly revenue trends, top-selling products, and sales performance by region or category. Through a clean and user-friendly layout, it helps users quickly understand the financial health of the organization and make data-driven decisions.
The dashboard includes charts and graphs that highlight changes in revenue over time, allowing users to identify trends, seasonal patterns, or sudden shifts. It also displays the best-performing products or services, enabling businesses to recognize what’s driving the most income. A regional performance breakdown further helps in understanding geographical strengths and opportunities for growth.
Built with Tableau’s powerful visualization tools, this project emphasizes visual clarity, interactivity, and real-time insights. Filters and drop-down menus make it easy to explore specific time frames, categories, or segments. This makes the dashboard suitable for managers, analysts, and stakeholders who need to monitor KPIs and guide business strategies.
Overall, the project demonstrates strong data visualization and analytical skills, making it an effective tool for performance tracking and strategic revenue planning in a dynamic business environment.
Built with